Ten Years of Tennessee Gun Death
To view or download a PDF version of this report, click here.
Gun deaths are on the rise in Tennessee, and continue to outpace the U.S. average in three key categories:
Firearm mortality, which includes all forms of fatal gun violence: all violence-related fatal shootings, including homicides, fatal domestic violence shootings, and legal intervention, to firearm suicides, to unintentional shootings, to shootings where the intent is undetermined.
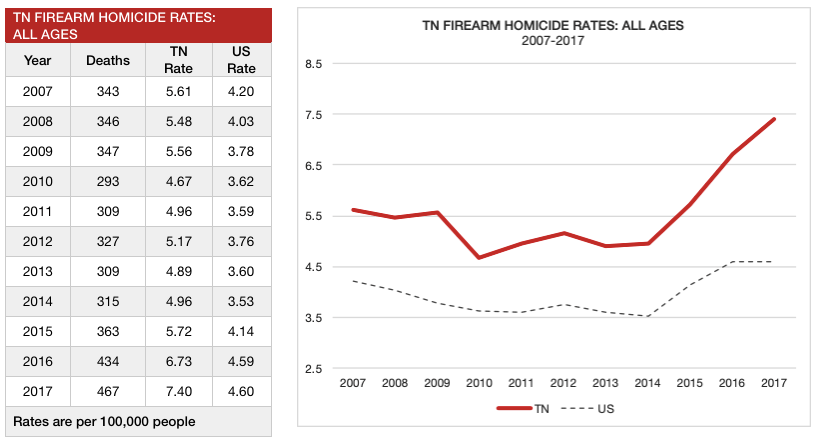
Firearm homicide, which includes all murders committed with a firearm.
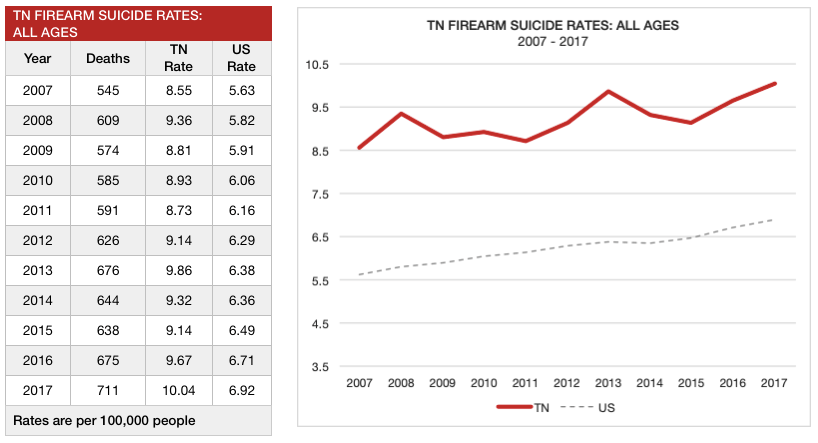
Firearm suicides, which include any completed suicide committed with a firearm.
Following are a series of charts that visualize the data in these three categories.
The data is from the Centers for Disease Control and Prevention, National Center for Injury Prevention and Control Web-based Injury Statistics Query and Reporting System (WISQARS) Fatal Injury Reports from 2017, the most recent year fatal injury data is available.
Each category is divided between all ages and ages 0-19.
The first set of charts represent rates (deaths per 100,000, or “per capita”) in Tennessee compared to the U.S. average.
The second set of charts represent rates in Tennessee compared to both the U.S. average and rates in Massachusetts, a state known for its strong gun laws.
Massachusetts is ranked as the 49th friendliest state for gun owners by Guns and Ammo. Tennessee is ranked 12th. In 2017, Massachusetts had a gun law strength grade of A according to the The Giffords Law Center to Prevent Gun Violence. Tennessee had a D-.
Each category has seen a significant increase over the last ten years, especially the last two years.
Of particular concern is the rise in firearm mortality for young people ages 0-19 where the rates of death have gone up considerably over the last several years, far outpacing the U.S. average.
- The rate of firearm mortality for ages 0-19 has more than doubled since 2007
- The rate of firearm homicides for ages 0-19 has nearly doubled since 2007
- The rate of firearm suicide for ages 0-19 has more than doubled since 2017
Overall, Tennessee is:
- 11th in the nation for firearm mortality
- 7th in the nation for firearm homicide
- 19th in the nation for firearm suicide
Massachusetts has some of the strongest gun laws in the nation and is most often the state with either the lowest or second lowest rate of firearm mortality in the country. In 2009, 2012, 2015, and 2016, it had the lowest, while in 2017 it had the second lowest. Tennessee is considered to have very lax gun laws. In the last ten years, Tennessee has never been lower than 14th.
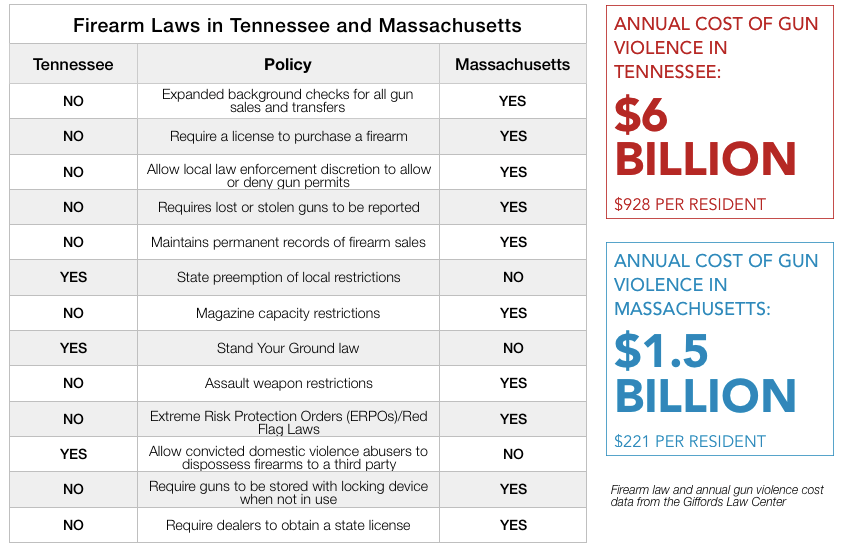
KEY FIREARM LEGISLATION PASSED IN TENNESSEE BETWEEN 2007 AND THE PRESENT
2008: “Guns in bars” law is passed, allowing permit holders to carry loaded guns in bars and restaurants
2013: “Guns in Trunks” law is passed, allowing permit holders to store loaded guns in their vehicles, even on private property that prohibits weapons
2014: “Guns in Trunks” law is expanded, allowing any legal gun owner to store loaded guns in their vehicles, even on private property that prohibits weapons
2015: “Guns in Parks” law allows is passed, allowing permit holder to carry loaded guns in any public park or playground, including those used by schools
2016: “Guns on Campus” law is passed, allowing permit holders who are faculty or full-time employees of public colleges and universities to carry loaded guns on college campuses
2017: A law is passed that allows permit holders to carry loaded guns on public transportation and includes a provision that allows an individual or organization to sue a city for triple damages if the city refuses to comply.
2017: A bi-partisan law is passed to strengthen domestic violence laws by requiring convicted domestic abusers to submit a dispossession form to the court following conviction.
2018: A law is passed creating a new gun permit that only requires an applicant to complete a background check and watch a short online video
2018: The House votes to overturn the 2017 firearm dispossession form law. The Senate will vote on the bill in 2020.
Firearm mortality includes all forms of fatal gun violence: all violence-related fatal shootings, including homicides, fatal domestic violence shootings, and legal intervention, to firearm suicides, to unintentional shootings, to shootings where the intent or motive is undetermined.
Based on this data, on average, 3.4 Tennesseans die every day from gun violence, or one person every 7.1 hours
Between 2007 and 2017, firearm mortality in Tennessee increased 20 percent for all ages and 53 percent for ages 0-19.
Firearm homicide includes any murder committed with a firearm, whether the murder is the result of an altercation, a domestic situation, a road rage shooting, or during the commission of a criminal act, such as an armed robbery or retaliatory shooting.
In 2007, the rate of firearm homicide involving individuals 0-19 in Tennessee was lower than the U.S. average. In 2017 it was nearly double the U.S average.
Between 2007 and 2017, firearm homicide in Tennessee increased 24 percent for all ages and 47 percent for ages 0-19.
Firearm suicide includes any completed suicide where a gun was used. Firearm suicides are unique in both their impulsivity and their lethality. Unlike other methods of suicide, firearm suicides take little planning and are almost always successful.
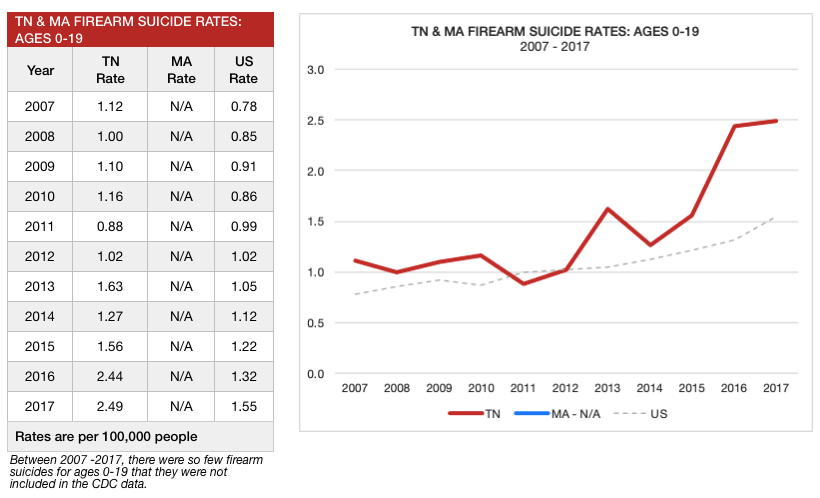
The number of young people in Tennessee who take their own life with a gun has more than doubled since 2007 and is significantly higher than the U.S. average.
Between 2007 and 2017, firearm suicide in Tennessee increased 15 percent for all ages and 55 percent for ages 0-19.
Massachusetts had the second lowest firearm mortality rate in the country in 2017, ranked only behind Hawaii.
The firearm mortality rate in Tennessee for all ages is almost five times higher than that of Massachusetts. For ages 0-19, Tennessee’s firearm mortality rate is more than four times that of Massachusetts.
Between 2007 and 2017, firearm mortality in Tennessee increased 20 percent for all ages and 53 percent for ages 0-19. Over the same time, firearm mortality in Massachusetts increased only 3 percent for all ages and decreased 5 percent for ages 0-19.
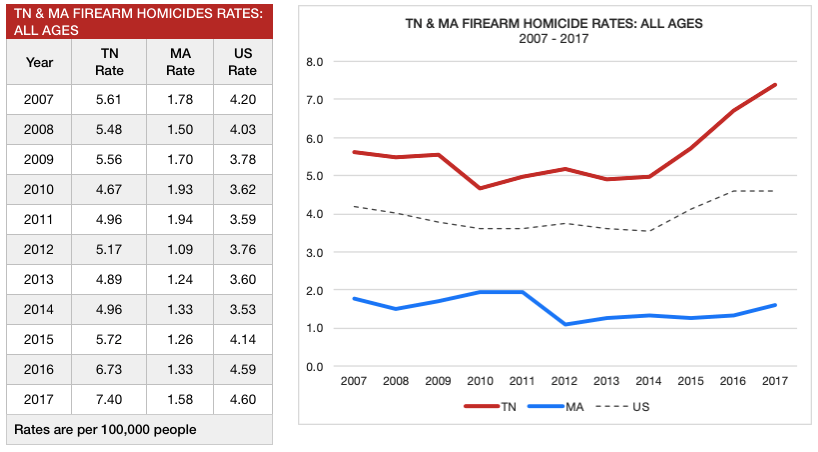
Massachusetts is ranked 41st in the nation for firearm homicides. Tennessee is 7th. While the Tennessee firearme homicide rate is much higher than the U.S. average, Massachusetts is far below.
The firearm homicide rate in Tennessee for all ages is almost five times higher than Massachusetts. For ages 0-19, Tennessee’s firearm homicide rate is more than three times that of Massachusetts.
Between 2007 and 2017, firearm homicide in Tennessee increased 24 percent for all ages and 47 percent for ages 0-19. Over the same time, firearm mortality in Massachusetts decreased by 13 percent for all ages and decreased 8 percent for ages 0-19.
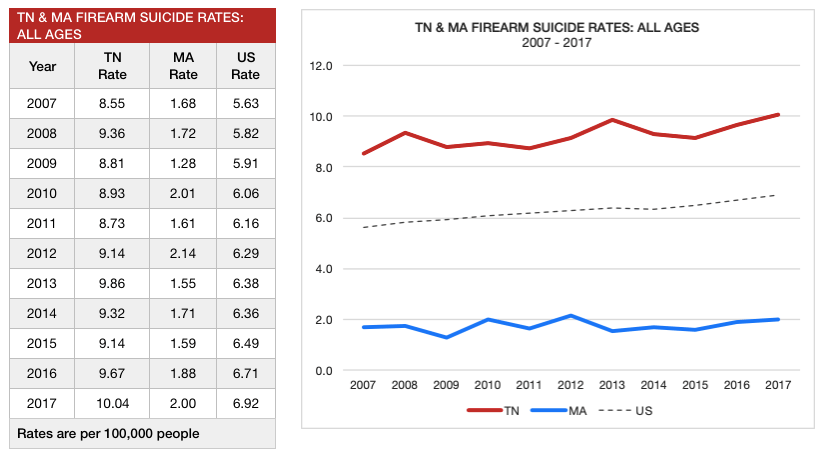
Massachusetts had so few firearm suicides involving ages 0-19 that they were not included in the CDC data, while Tennessee’s rate of firearm suicides in the same age group more than doubled, with the largest increases in the last few years
The firearm suicide rate in Tennessee for all ages is over five times higher than Massachusetts.
Between 2007 and 2017, firearm suicide in Tennessee increased 15 percent for all ages and 55 percent for ages 0-19. Over the same time, firearm suicides in Massachusetts increased by 16 percent for all ages. There were too few firearm suicides n the 0-19 age group to be logged by the CDC.
To view the data set used for this report, click here
For more information and context about firearm death rankings, including 2017 state rankings for firearm mortality, homicide, and suicide, click here
